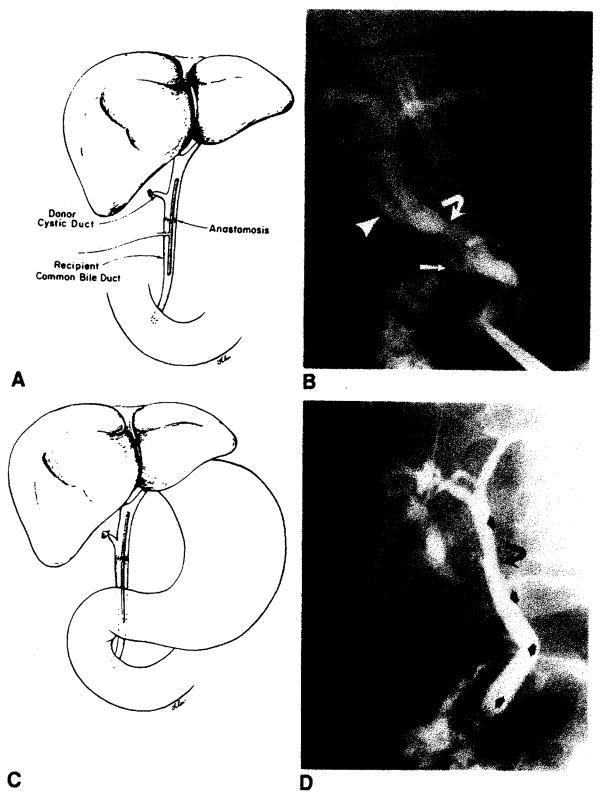
Fig. 1.
Normal choleclochochotedochostomy. A, Schematic diagram demonstrates T-tube stent, donor cystic duct remnant, and anastomosis. T-tube enters choledochotomy in recipient’s common bile duct. B, T-tube cholangiogram demonstrates donor’s (arrowhead) and recipient’s (arrow) cystic duct remnants and anastomosis (curved arrow). This anastomosis between donor’s common bile duct and recipient’s common hepatic duct is less frequently performed than common bile duct-to-common bite duct anastomosis shown in A. C, Schematic diagram demonstrates straight internal stent across biliary anastomosis. D, PTC demonstrates anastomosis (curved arrow) and position of stent (arrows).

