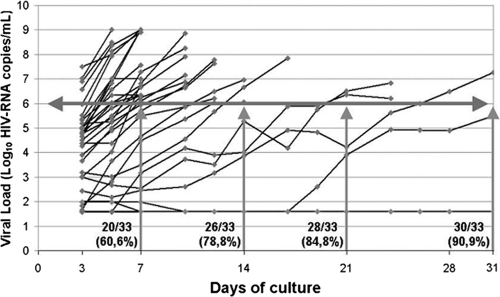
FIG. 1.
Viral dynamics during coculture. The horizontal gray line represents the threshold of positive cultures (>1 × 10⁶ HIV RNA copies/ml). Vertical gray lines show the positive cultures and cumulative frequencies after 7, 14, 21, and 31 days of culture. Black lines represent the viral production from each patient. Cultures were stopped if more than two consecutive measurements were above 1 × 10⁶ HIV RNA copies/ml.

