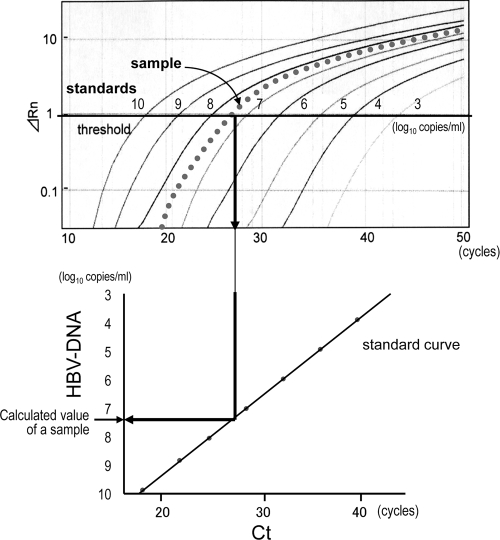
FIG. 3.
Calculation of values from the results obtained by real-time PCR. The threshold was set in the linearly increasing region of accruals of fluorescence signals (ΔRn), and the threshold cycle (CT) was measured. The value of the target strain was calculated from the CT number and a standard curve for each strain. The measurement was performed separately with each MGB probe and noncomplementary PNAs for all sets of target strains. Solid lines, 10-fold serially diluted standards; dotted line, a sample of the target strain.

