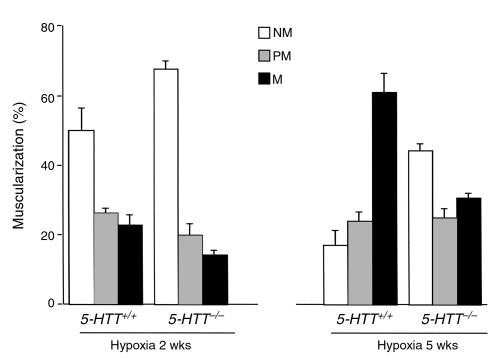
Figure 4.
Distribution of vessels according to the accompanying airway. Fifty to 60 intraacinar vessels were analysed in each lung from mice of each genotype after exposure to hypoxia for 2 weeks (n = 9 of each genotype) or 5 weeks (n = 8 of each genotype). Percentages of nonmuscular (NM), partially muscular (PM), or fully muscular (M) vessels determined separately at the alveolar duct and alveolar wall levels differed significantly between 5-HTT+/+ and 5-HTT–/– mice after exposure to hypoxia for either 2 weeks (P < 0.01) or 5 weeks (P < 0.001).

