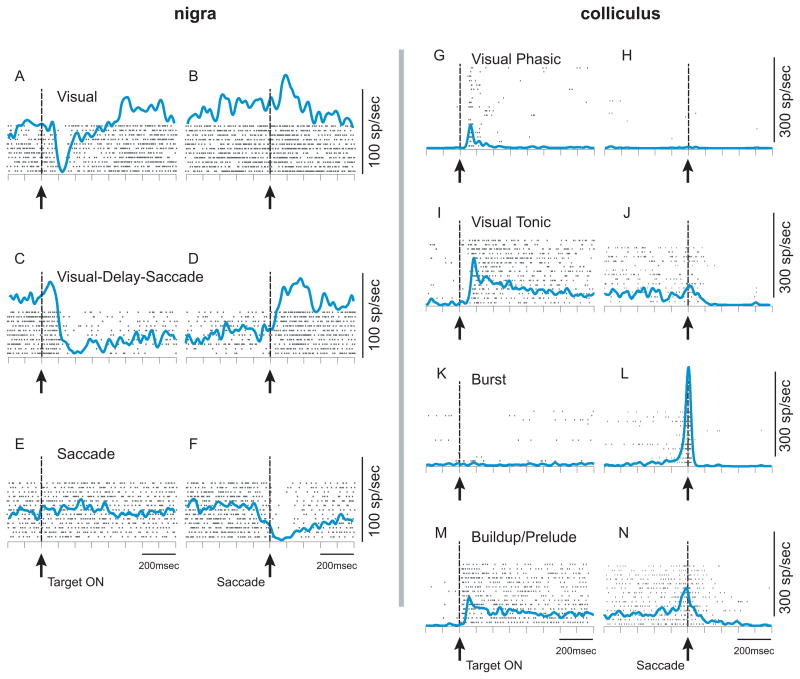
Figure 2.
Response profiles of nigral and collicular neurons are varied. Each tick represents the time of occurrence of an action potential. Each row of ticks indicates an individual trial. The blue lines show the spike density functions (σ = 12ms for the nigra and 10ms for the colliculus). The vertical dashed lines and upward arrows in each panel indicate the alignment times. Panels A, C, E, G, I, K, M are aligned on the onset of the visual stimulus labeled ‘Target on’. Panels B, D, F, H, J, L, N are aligned on saccade onset, labeled ‘Saccade’. Panels A–F are from nigral neurons. Panels G–N are collicular neurons. These data were collected while monkeys performed a visually-guided delayed saccade task. The neurons are not all from the same monkeys. Note that at the relevant phases of the task – visual target onset, delay-period and saccade, the nigral response is a reduction in firing rate, whereas that of the colliculus is an elevation in firing rate.

