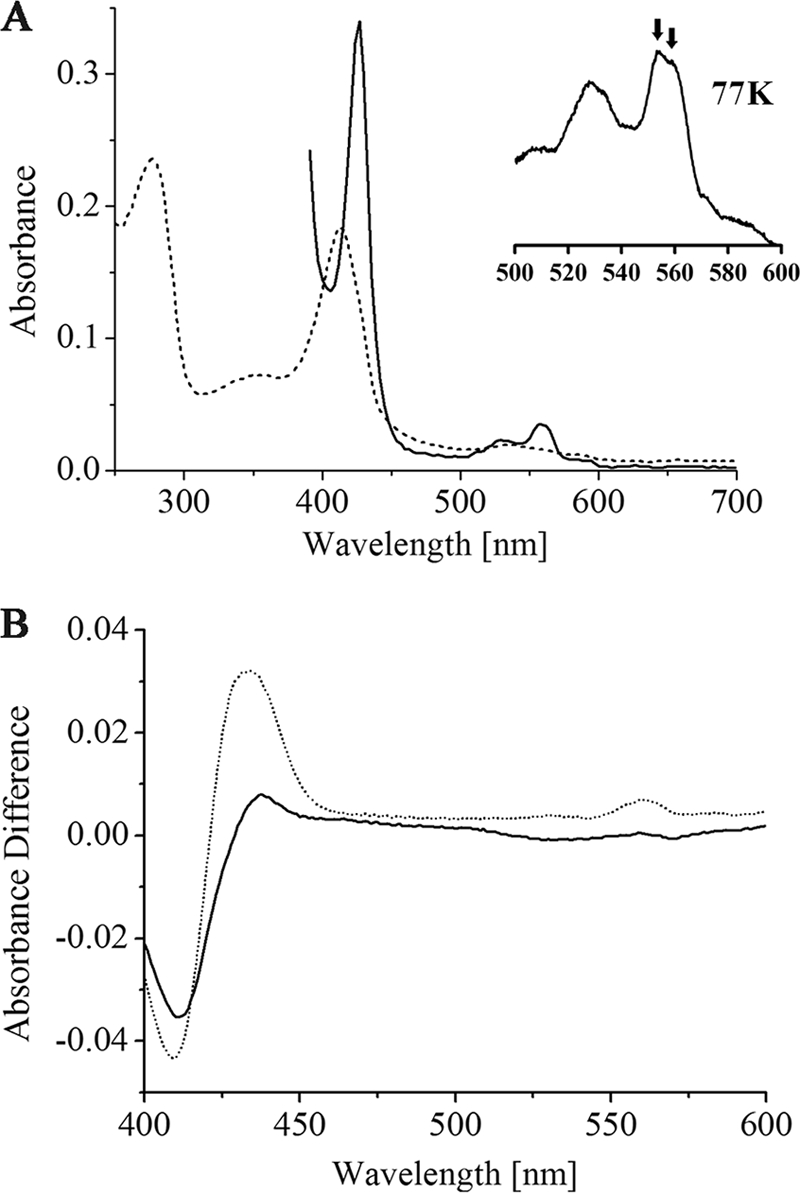
FIG. 3.

(A) UV/Vis spectra of recombinant DsrM in the oxidized state (dotted line) and in the dithionite-reduced state (solid line); the inset in spectrum A is a close-up of the 500- to 600-nm region recorded at 77 K; the arrows indicate the two maxima of the split α band. (B) Reduced minus oxidized difference spectra of menadiol reduction assays of DsrM, after addition of menadiol (solid line) and after addition of dithionite (dotted line).
