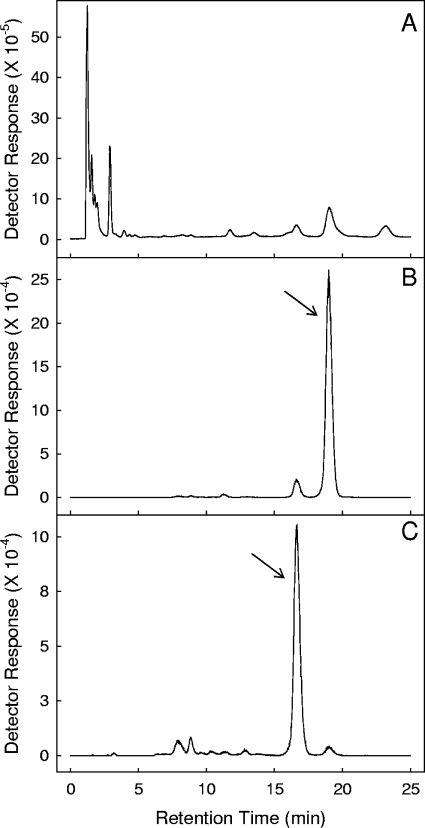
FIG. 3.
Representative mass spectral analysis of neutral lipids extracted from M. tuberculosis. (A) Total ion chromatogram. (B) Extracted ion chromatogram for 787.6315 Da, which corresponds to the molecular ion of MK-9(II-H2). (C) Extracted ion chromatogram for 785.6158 Da, which corresponds to the molecular ion of MK-9. Arrows indicate the peaks assigned to MK-9 (B) and MK-9(II-H2) (C).

