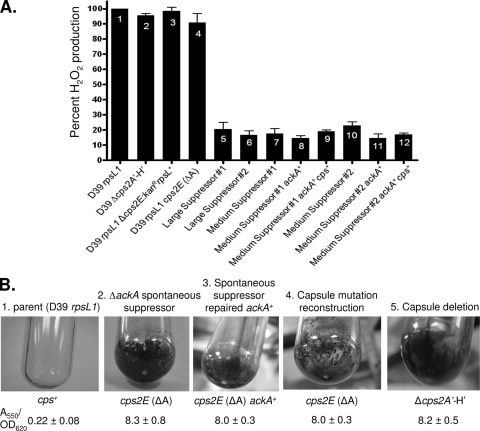
FIG. 2.
H2O2 production (A) and biofilm formation (B) by ΔackA suppressor mutants. (A) H2O2 production was determined relative to the parent strain (IU1781; bar 1) in limited aeration (static) cultures as described in Materials and Methods, and standard errors from multiple independent determinations are indicated. Bars 2 to 4, constructed unencapsulated mutants; bars 5 and 6, mucoid large colony suppressors; bars 7 and 10, medium-size rough colony suppressors; bars 8, 9, 11, and 12, medium-sized rough colony suppressors in which the ΔackA and cps2E (ΔA) mutations were repaired to the ackA+ and cps2E+ alleles. Relevant genotypes are shown and are also listed in Table S1 of the supplemental material. Bar 2, strain IU1945; bar 3, IU3286; bar 4, IU3309; bar 5, IU3254; bar 6, IU3255; bar 7, IU3250; bar 8, IU3252; bar 9, IU3311; bar 10, IU3251; bar 11, IU3253; bar 12, IU3313. (B) Biofilms formed by overnight cultures in polystyrene tubes were stained with crystal violet and quantitated based on the A550 as described in Materials and Methods. Panels from left: 1, parent encapsulated strain IU1781; 2, unencapsulated strain IU3250, a rough, medium-sized colony ΔackA suppressor containing the spxB (Trp339STOP) and cps2E (ΔA) mutations; 3, unencapsulated strain IU3252, medium-sized rough colony suppressor IU3250 repaired back to ackA+; 4, unencapsulated strain IU3309, an ackA+ spxB+ strain containing the constructed cps2E (ΔA) allele; 5, unencapsulated strain IU1945, an ackA+ spxB+ strain containing the large Δcps2A′-Δcps2H′ deletion. See Table S1 for full genotypes. A550 values after crystal violet staining were normalized to the density (OD620, ≈0.5 to 0.6) of the culture supernatants containing unattached cells. Averages are based on three or more independent determinations, and standard errors are indicated.

