Figure 5.
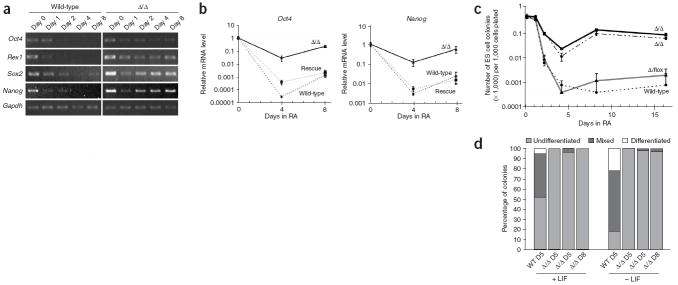
Monolayer differentiation of ES cells in the presence of retinoic acid. (a) RT-PCR analysis of pluripotency markers. Wild-type and Dgcr8 knockout ES cells were plated as a monolayer and treated with retinoic acid (RA) in the absence of LIF to induce mesenchymal differentiation. Gapdh was used as a loading control. (b) Quantitative PCR analysis of the pluripotency markers Oct4 and Nanog (n = 3). The β-actin gene was used as a reference. For each sample, data were normalized to the mRNA level at day 0. (c) ES cell colony formation of differentiated cells. After varying durations of monolayer differentiation, cells were returned to ES cell culture conditions and assayed for their ability to form alkaline phosphatase–positive colonies. Error bars indicate the range of measurements (n = 3). (d) Clonal analysis of ES cell differentiation in the absence of MEF feeders and in the presence or absence of LIF, as indicated. Shown are percentages of undifferentiated, mixed and differentiated colonies under the indicated conditions. ‘D5’ indicates 5 d; ‘D8’ indicates 8 d.

