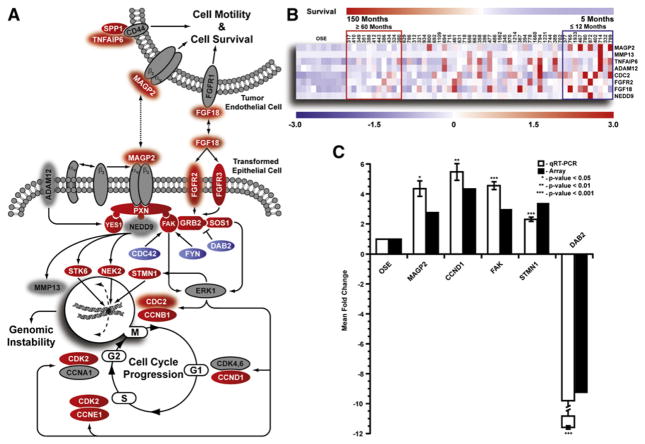
Figure 2. Assessment of Putative Signaling Events Contributing to Patient Survival.
(A) Pathway analysis of select differentially regulated genes identified in the 53 microdissected serous tumors, as compared to 10 normal OSE brushings (red, upregulated; blue, downregulated; gray, no change; red halo, survival-associated gene).
(B) Heat map demonstrating association between survival signature genes identified in the pathway and overall patient survival. Increased expression of one or more genes greatly reduced patient survival.
(C) qRT-PCR validation of select genes identified in the pathway analysis for all 53 tumor samples and 10 normal OSE. Error bar represents mean fold change ± SD.

