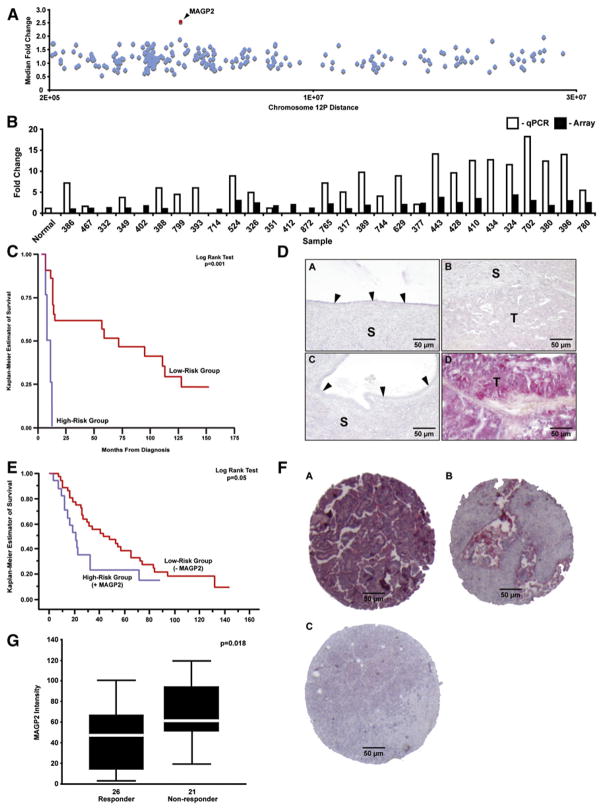
Figure 3. The MAGP2 Locus Is Amplified in Serous Ovarian Tumors and Its Expression Products Are Significantly Correlated with Overall Survival and Chemoresponse.
(A) Oligonucleotide microarray CGH for 42 of the serous tumors established the median MAGP2 copy number (2.5) on chromosome 12p. MAGP2 is highlighted in red.
(B) qPCR correlated with the CGH microarray data for 29 of the serous tumors (r = 0.61, p = 0.004).
(C) Kaplan Meier survival analysis of MAGP2 mRNA expression using the 53 patients with stage III/IV high-grade serous ovarian cancer demonstrated a significant difference in patient outcome (p = 0.001).
(D) Low-level MAGP2 protein staining was observed in normal surface epithelia (A), epithelial and stromal components of benign ovarian cysts (C), and in some high-grade serous tumors (B). Strong MAGP2 staining was observed in a small proportion of high-grade serous ovarian tumor tissues (D). Arrowheads indicate the epithelial layer of the normal ovary and benign ovarian cyst (S, stroma; T, tumor cells).
(E) Kaplan Meier survival analysis of MAGP2 protein expression using 53 patients with stage III/IV high-grade serous ovarian cancer. A statistically significant difference was observed between the outcome groups (p = 0.05).
(F) Independent TMA validation of MAGP2 expression in 64 serous ovarian cancers. A, high-level staining; B, moderate staining; C, low-level staining.
(G) Box plot analysis of MAGP2 protein expression levels among chemotherapy responders and non-responders. A significant correlation was found between poor response and increased MAGP2 protein levels (p = 0.018).

