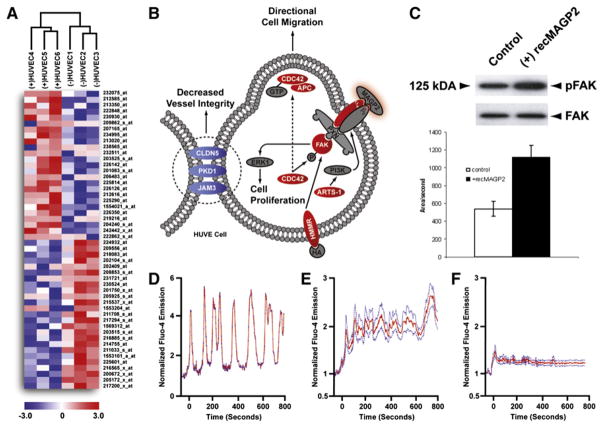
Figure 6. Identification of Putative Signaling Events Mediating the Effects of MAGP2 on HUVECs.
(A) Hierarchical clustering of recMAGP2-treated (n = 3) and untreated (n = 3) HUVECs following supervised class comparison. The top 50 differentially regulated probe sets are displayed (red, upregulated; blue, downregulated).
(B) Signaling events stimulated in HUVECs treated with recMAGP2 as compared to untreated cells. Differentially regulated genes were identified (red, upregulated; blue, downregulated; gray, no change).
(C) recMAGP2 treatment of HUVECs increased the proportion of phosphorylated FAK, as compared to untreated cells. Error bar represents the area/second mean ± SD of three independent experiments.
(D) Time course changes in [Ca2+] levels in a single recMAGP2 induced in a single HUVEC.
(E) Mean normalized time course changes in [Ca2+] induced by recMAGP2 in HUVECs.
(F) Mean normalized time course of changes in [Ca2+] induced by recMAGP2 in HUVECs pre-treated with GRGDSP competitor peptide.

