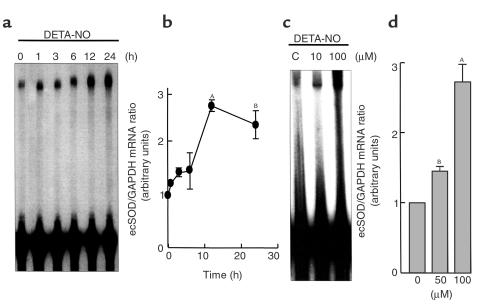
Figure 1.
RNase protection assays showing time course (a and b) and dose dependence (c and d) of ecSOD mRNA expression in response to DETA-NO in HASMs. HASMs (passages 4–8) were exposed to DETA-NO (100 μM) for the times indicated (a and b) and for the dose indicated at the 12 hour time point (c and d). The levels of ecSOD mRNA levels were determined using RNase protection assays using human ecSOD and GAPDH riboprobes as an internal control. (a and c) Representative RNase protection assay. (b and d) Mean data for three separate experiments. AP < 0.01; BP < 0.05 versus control cells.

