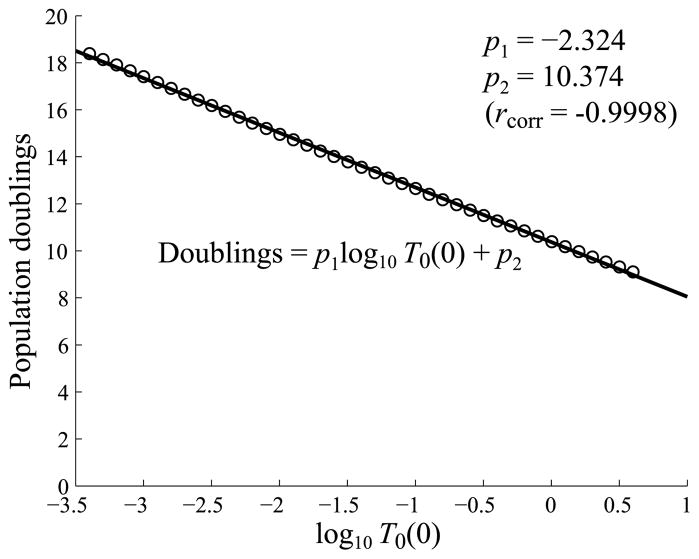
Fig. 14.
Plots of the number of T cell population doublings, defined by log2(max(Ttotal/T0(0))), versus log10 T0(0). The plot shows that if the system starts with a higher precursor concentration, effector cells divide fewer times on average. Likewise, if the system starts with a lower precursor concentration, T cells divide a greater number of times to compensate. The linear correlation rcorr = −0.9998.

