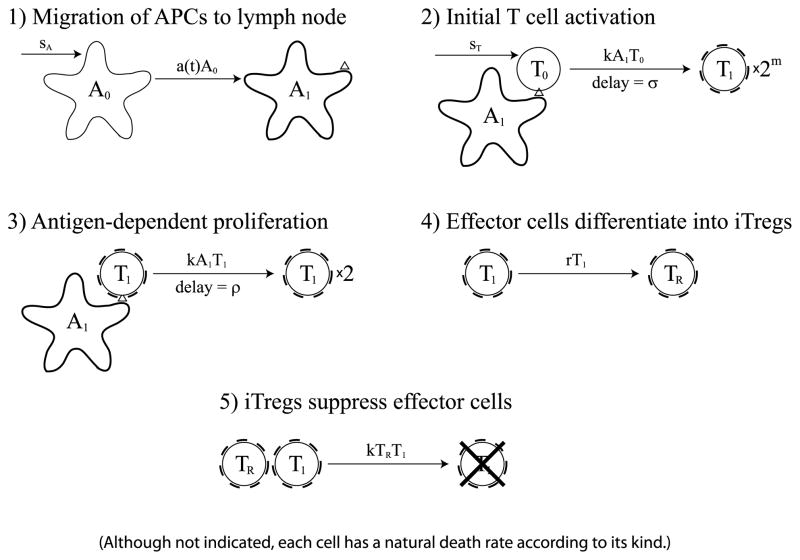
Fig. 4.
Diagram of the iTreg model. The first three steps are identical to those in the cell division-based model that is shown in Fig. 1. In the fourth step, effector cells differentiate into iTregs at rate r. In the fifth step, iTregs suppress effector cells. Although not indicated, each cell in the diagram has a natural death rate according to its kind.

