Fig. 5.
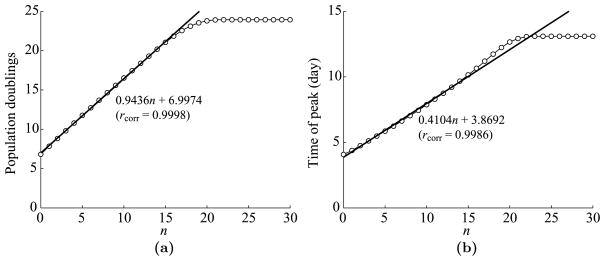
Dependence of T cell dynamics on n, the maximum number of antigen-dependent divisions after the minimal program. (a) Maximum T cell expansion level versus n. The expansion level is measured in population doublings, which is defined by log2(max(Ttotal/T0(0))). The regression coefficient is fit to the first 17 points, i.e., n = 0, …, 16. The linear correlation rcorr = 0.9998. (b) The time of T cell peak versus n. The linear regression is fit to the first 17 points. The linear correlation rcorr = 0.9986.

