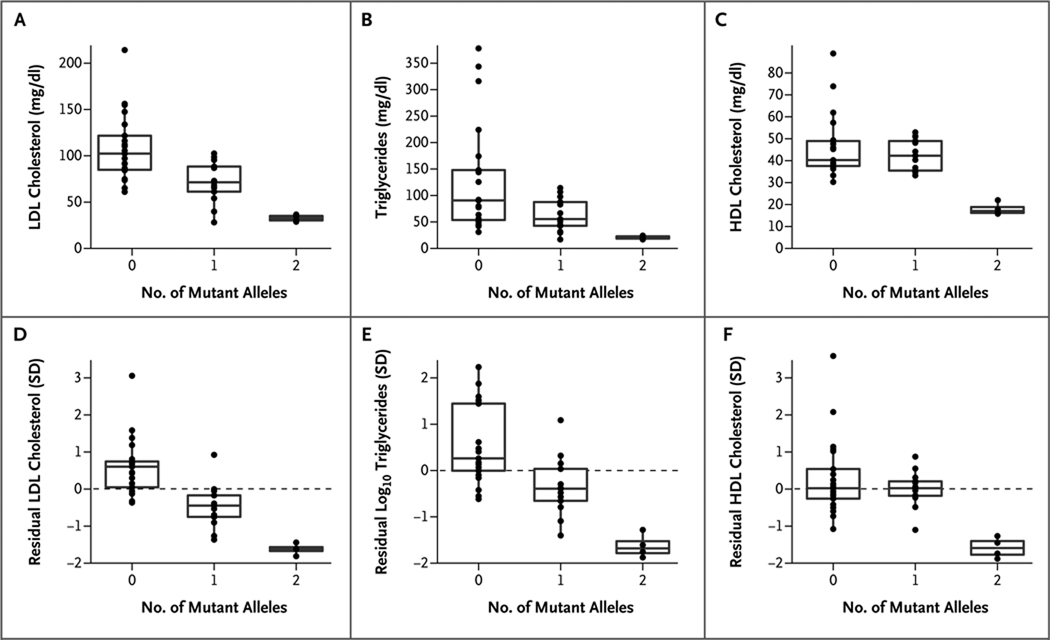
Figure 2. Phenotypes Associated with Familial Combined Hypolipidemia in the Study Family, According to Number of Mutant ANGPTL3 Alleles.
Shown are the levels of low-density lipoprotein (LDL) cholesterol (Panel A), triglycerides (Panel B), and high-density lipoprotein (HDL) cholesterol (Panel C) in the family members, grouped according to ANGPTL3 genotype. The corresponding “residual” phenotypes are shown (in Panels D, E, and F, respectively), in units normalized to the standard deviation, after adjustment for age, age squared, and sex. The box plots give the median levels (middle horizontal line in each box), the interquartile ranges (delineated by the top and bottom of each box), and outliers falling below the 5th percentile or above the 95th percentile (points below or above the vertical lines, respectively). To convert values for cholesterol to millimoles per liter, multiply by 0.02586. To convert values for triglycerides to millimoles per liter, multiply by 0.01129.

