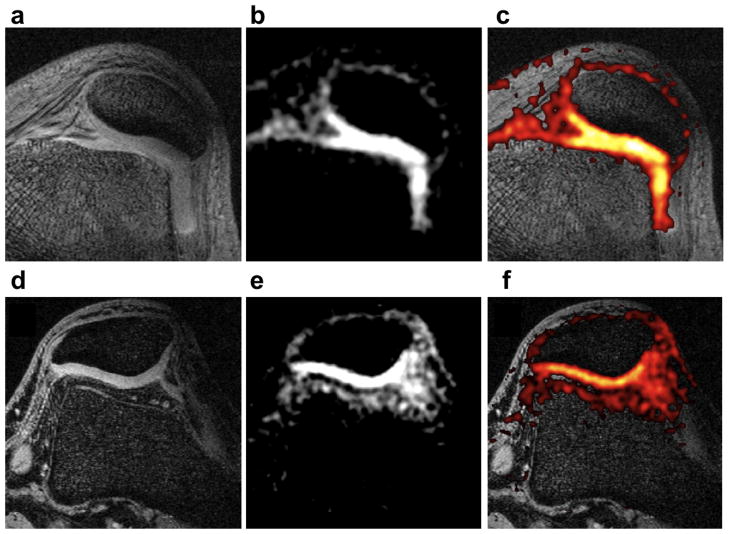
Figure 1. Axial knee image at 7 T.
(a) and (d) Detail of proton images of patellar cartilage with resolution of 0.4×0.6×2.0 mm3. (b) Standard-resolution (1.3×1.3×4.0 mm3, voxel volume of 6.8 μl) sodium image from the full 3D volume acquired (cartilage SNR = 16). (e) High-resolution (1.0×1.0×2.0 mm3, voxel volume of 2 μl) sodium image from the full 3D volume acquired (cartilage SNR = 9). (c) and (f) Overlay of the color-mapped sodium image onto the anatomic data. These images shows higher sodium signal in the patellar cartilage than in the subcutaneous region. This is expected since the sodium concentration in healthy cartilage is about two times larger than in subcutaneous tissue. The high-resolution image shows a better delineated cartilage due to a thinner slice and reduced partial volume artifact. The high-resolution images have an average SNR that is about 61 % that of the standard resolution images at 7 T. This difference can be explained considering the variations in voxel size, readout time, and scan time.

