
Figure 2. Axial knee images at 3 T.
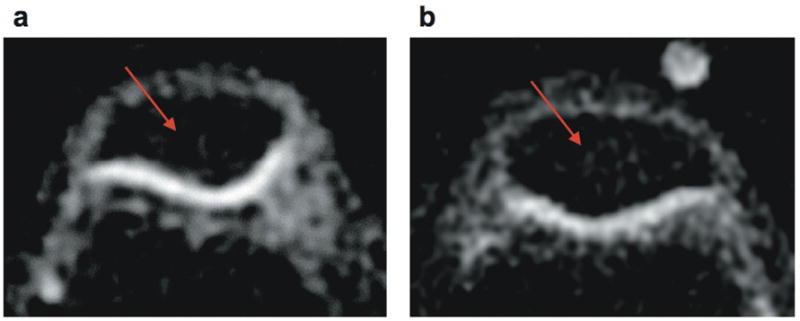
(a) Detail of standard-resolution (1.3×1.3×4.0 mm3, voxel volume of 6.8 μl) sodium image of patellar cartilage (cartilage SNR = 9). (b) Detail of high-resolution (1.0×1.0×2.0 mm3, voxel volume of 2 μl) sodium image of patellar cartilage (cartilage SNR = 8). The displayed FOV is 7×5 cm2. The cartilage is distinguishable even without the aid of an anatomical proton image given its relatively high sodium content. The high-resolution image (b) shows a thinner cartilage profile given the smaller partial volume effects, yet the image quality in panel (a) is clearly better reflecting the higher SNR. This difference can be seen in the sections inside the patellar signaled by the red arrow, where image (b) exhibits more noise than panel (a).