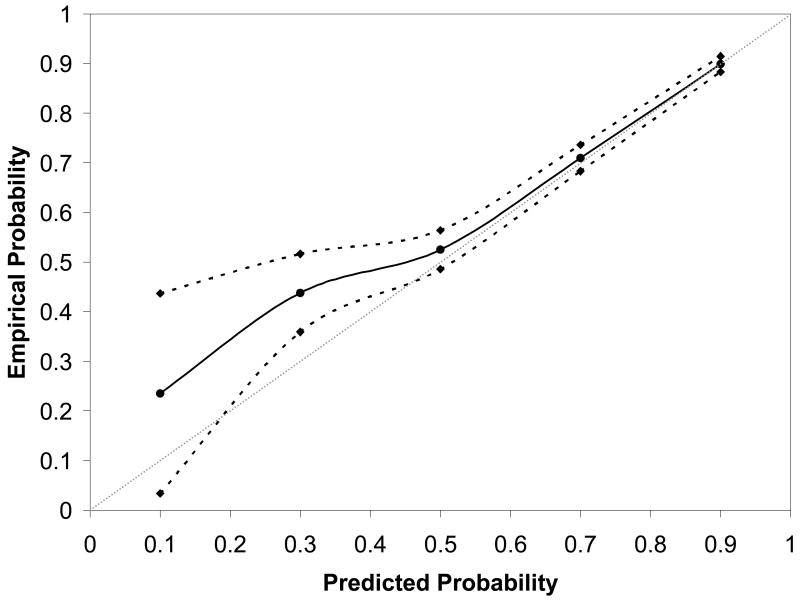
Figure 4.
Nomogram calibration for the prediction model that incorporates patient factors available only at the first prenatal visit. In both figures, the reference line, which an ideal nomogram would produce, is represented by the dotted diagonal line; the actual performance of the current nomogram is represented by the solid line; its 95% confidence band is represented by the two dashed lines. BMI = body mass index.

