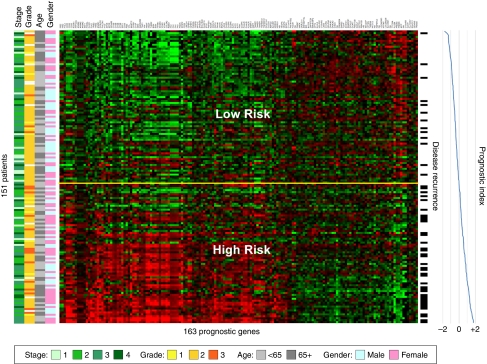
Figure 2.
Gene expression heatmap of the 163-probe colon cancer prognosis signature in a subset of the stage 1–4 training series. Patients without recurrence and less than 3-years follow-up, or recurrence events >10 years, have been excluded. Rows indicate patients (ordered by prognostic index), columns indicate probes (ordered by hierarchically clustering using average linkage similarity). Red colour indicates high gene expression, green colour indicates low gene expression (log2 scale). Recurrence events are indicated to the right of the heatmap. Yellow horizontal line corresponds to the classification threshold, determined during algorithm training. The colour reproduction of this figure is available on the html full text version of the manuscript.

