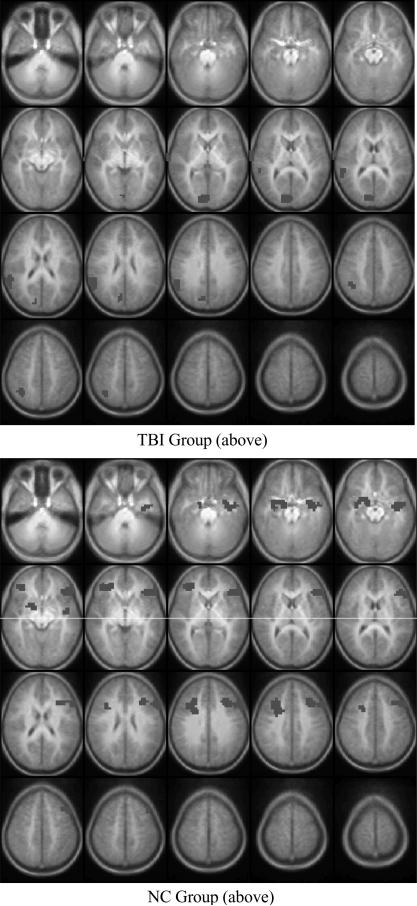
Fig. 3.
Statistical parametric map showing brain regions, by group, in which activation level in the Imagery – Repetition contrast was significantly correlated with memory performance. Top: TBI group, and Bottom: NC group. Only positively correlated activation foci are shown. Please see Table 6 for listing of activation foci. Image conventions and parameters are as in Fig. 1.

