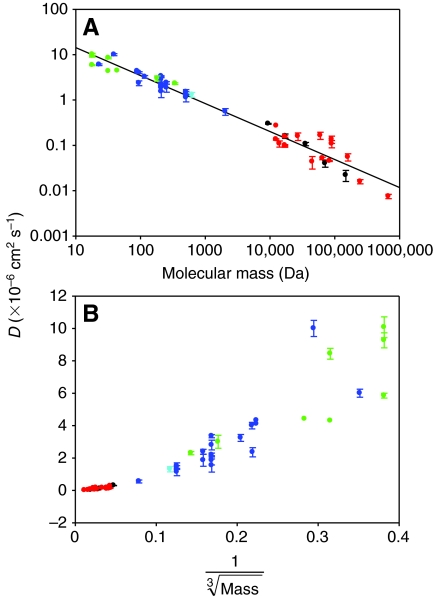
Fig. 3.
Relationship between the diffusion coefficient (D) in muscle and molecular mass for a diversity of skeletal muscle and molecule types. D values have been corrected to a temperature (T) of 20°C using a Q10 for diffusion in muscle of 1.28 (Hubley et al., 1995). Only freely diffusing species are plotted here. Molecules that are bound or compartmentalized in the fiber (e.g. Ca2+) or those macromolecules or complexes (e.g. polysomes) that are too large to move through the fiber have lower D values than would be predicted from molecular mass (not shown). Green: small, uncharged molecules; blue: ions or small charged metabolites; red: proteins; black: dextrans; cyan: the small, fluorescent probe calcein-AM. See text for additional details. Regression line: D=87.09×molecular mass–0.69, R2=0.86, P<0.0001. Data are means ± s.e.m. D values were obtained from the studies discussed in the text.

