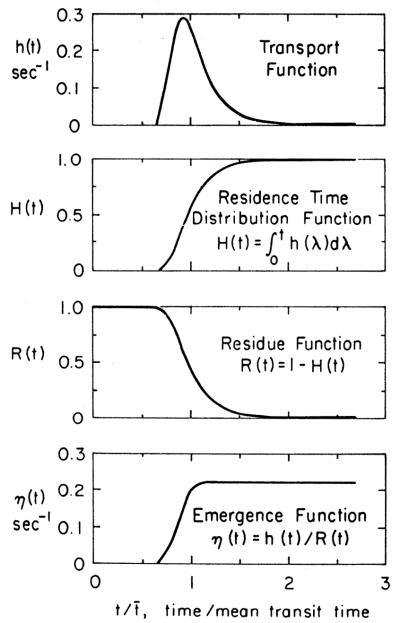
FIG. 2.
Relationships between h(t), H(t), R(t), and η(t). Curve of h(t) is in this instance given by a unimodal density function having a relative dispersion of 0.33 and a skewness of 1.5. However, the theory is general and applies to h(t)s of all shapes. Tail of this h(t) curve becomes monoexponential and hence η(t) becomes constant.

