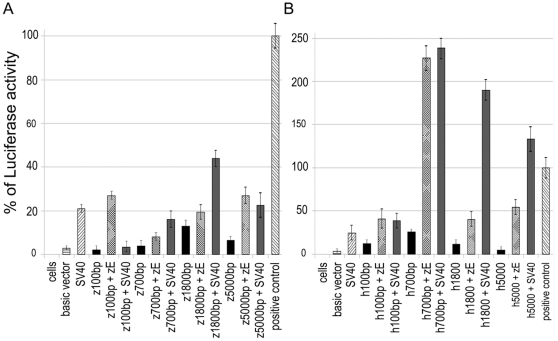
Figure 3. Analysis of prep1.1 and Prep1 promoter regions activity in HeLa cells.
The graphic data are expressed as relative Luciferase activity (normalized againstb the co-transfected beta-galactosidase), defined as % of luciferase activity. The value of 100% is given to the positive control (SV40 promoter + enhancer). A) Activity of the constructs of zebrafish prep1.1 5′ regulatory regions. B) Activity of the constructs of human Prep1 5′ regulatory regions. zE, zebrafish enhancer element (see text).

