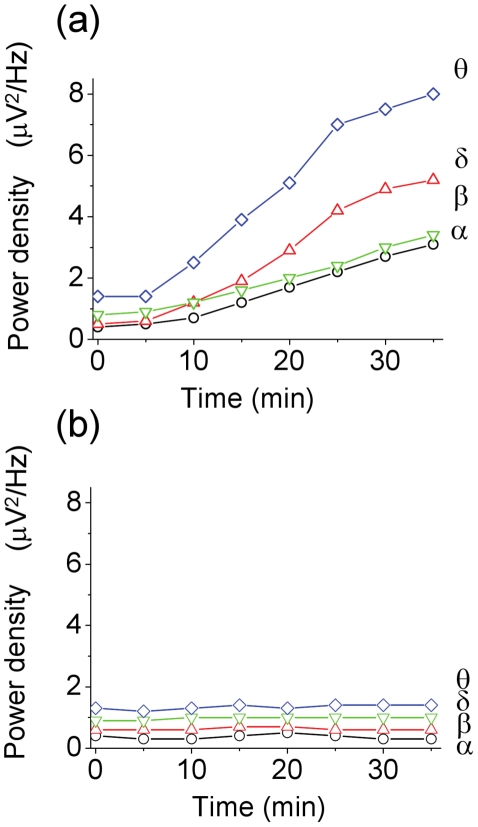
Figure 2. Quantified EEG power density analysis before and under the MDA treatment.
The time course of EEG power density of different frequency was monitored under 20 µM MDA treatment (panel a) and that of control (panel b). Data were means from 15 turtles (n = 15), respectively. The statistic data are shown in Tab. 1.

