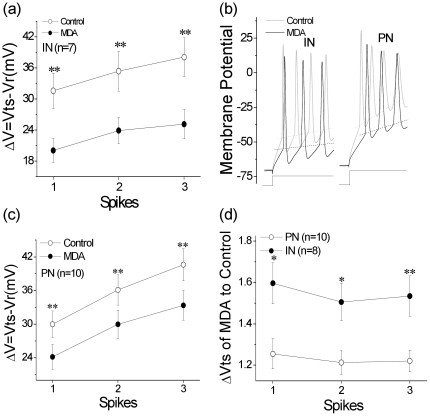
Figure 4. The comparison of threshold potentials of sequential spikes (ΔVts) and the absolute refractory periods (ARP).
The threshold potentials (Vts) of IN and PN before and after 20 µM MDA treatment were shown in panel a and c. The membrance potentials were as indicated in panel b. ΔVts were presented in panel d (* p<0.05, **p<0.01).

