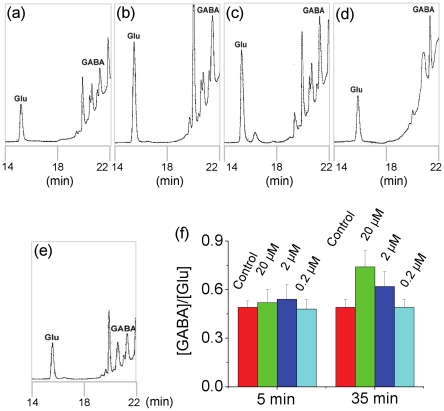
Figure 5. HPLC analysis of Glu and GABA content in turtles' brain under MDA treatment.
Chromatograms were recorded in 5 minutes (panel a) and 35 minutes (panel b), under 20 µM MDA treatment. Then, chromatograms were recorded in 35 minutes under the treatment of 2 µM MDA (panel c); 0.2 µM MDA (panel d); and the phosphate buffer as control (panel e). The HPLC peak area was estimated to calculate the ratio of [GABA]/[Glu] from the brain extract of turtles at different time intervals under the MDA and control treatments (panel f).

