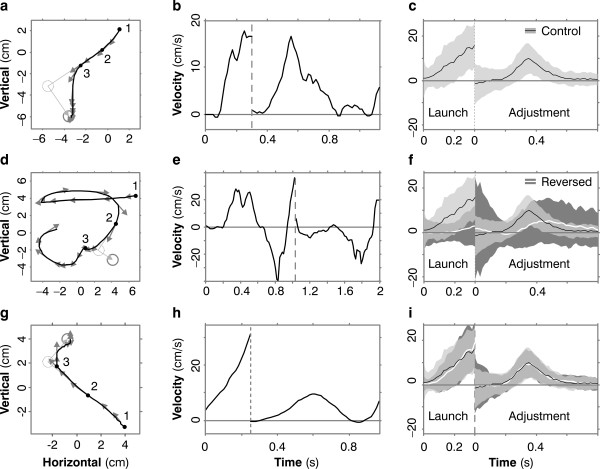
Figure 2.
Sample trajectories for one subject. (a) A typical trajectory under control conditions (without reversed sensitivity derivatives). The cursor is at position 1 when the target appears (dotted gray circle). The cursor moves (black line) towards the target. Gray arrows are cursor-velocity vectors. When the cursor is at 2 the target jumps to its new location (solid gray circle). Near 3 the cursor adjusts course appropriately. (The markers 1, 2 and 3 have these same meanings in panels d and g also). (b) The same pattern is seen when we plot components of cursor velocity. Before the target jump (vertical dashed line), we plot cursor velocity in the direction from initial cursor location to initial target location; appropriately, this velocity is positive. After the jump, we plot cursor velocity in the direction of the jump, again appropriately positive. (c) The same pattern is seen in averaged velocity traces. Here we see cursor velocity -- mean (black line) and standard deviation (light gray band) over 200 randomly chosen control trials. Velocity is mainly positive, as it should be, during both launch and adjustment. (d) In early reversed trials, launch and course adjustments go the wrong way. (e) These errors are revealed also in velocity traces. (f) The white line and dark gray band are the mean and SD of cursor velocity over the first 200 reversed trials. As in Panel c, the black line and light gray band are the control data, and the light gray is transparent so that the dark gray data show through, for comparison. In the reversed trials, launch and adjustment are impaired, i.e. they are not consistently positive, and those portions that are positive occur later than in the control trials. (g, h) In late reversed trials, after the subject has learned, launch and adjustment are both correct. (i) Velocities averaged over 200 randomly chosen late reversed trials resemble controls.

