Figure 4.
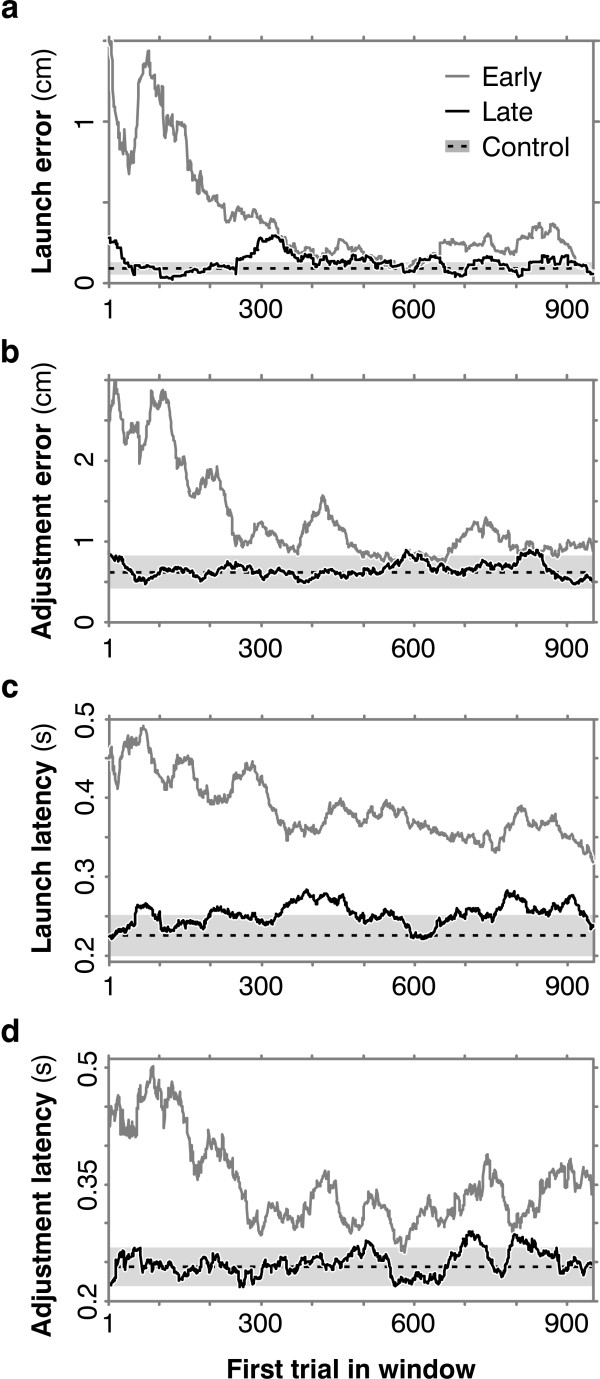
Moving-window averages. (a) To study changes through time we plot averages over a moving window of 50 trials, e.g. in this panel, the height of the curve above the 300 tick mark is the average launch error for trials 300-349; the rightmost point in the curve is the average for trials 951-1000. The plot shows that as the subject learns, launch error falls to control levels. The gray curve shows launch errors improving over this subject's first 1000 reversed trials. Black shows the final 1000 reversed trials. The light gray band is the mean ± 1 SD of the averaged launch error across all 950 windows in the initial control session. (b) Adjustment error also falls to control levels, as do (c) launch latency and (d) adjustment latency.

