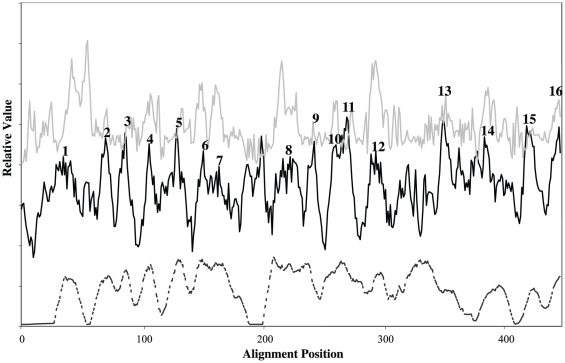
Figure 5. Average hydropathy, amphipathicity, and similarity plots for the β-barrel domains of the 69 Intimin/Invasin proteins included in this study.
The plots were generated with the AveHAS program [38]. A window size of 9 residues with the angle set at 180° was used as is appropriate for β-strand analyses. Average hydropathy, dark solid line, middle; Average amphipathicity, faint solid line, top; Average similarity, dashed line, bottom. These plots present relative values as a function of alignment position for all three characteristics.

