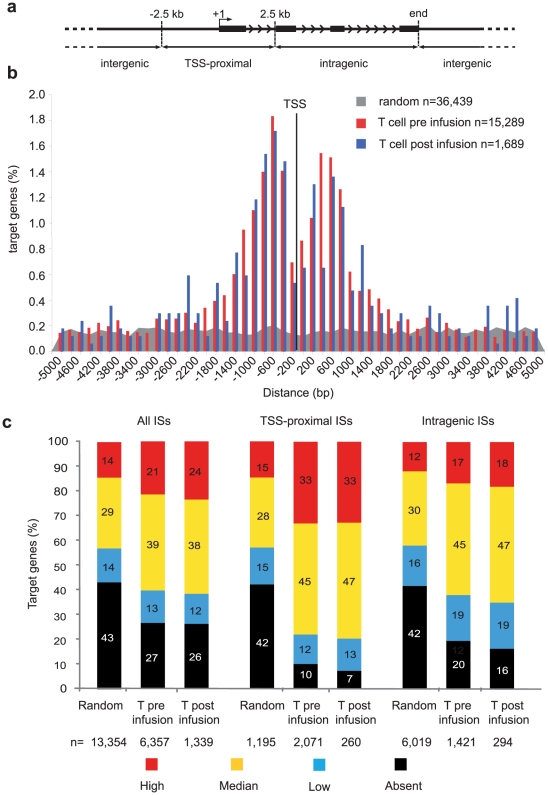
Figure 1. Genomic distribution and correlation with gene expression of MLV integration sites in human T cells.
(a) MLV and random integration sites were annotated as TSS-proximal when located at ±2.5 kb from a transcription start site (TSS, +1) of a Known Gene (UCSC definition), intragenic when inside a gene at >2.5 kb from the TSS, and intergenic in any other case. Black bars represent exons of a schematic gene, arrowhead indicate the direction of transcription. (b) Distribution of the distance of MLV vector integrations from the transcription start site (TSS) of targeted genes in pre-infusion (red bars), and post-infusion (blue bars) T cells, at 200-bp resolution. The % of the total number of targeted genes (n) is plotted on the Y axis. The grey area indicates the distribution of control random sites. (c) Histogram distribution of expression values from an Affymetrix microarray (HG-U133 plus 2.0) analysis of RNA obtained from mock-transduced T lymphocytes. Affymetrix probe sets were re-annotated with custom CDF files [18] to obtain a single expression value for each gene. Expression levels were divided into four classes: absent (black portion of histogram bars), low (below the 25th percentile of the normalized distribution, blue), intermediate (between the 25th and the 75th percentile, yellow) and high (above the 75th percentile, red). The percentage distribution of the expression values of genes targeted by all integration/random sites (all ISs), TSS-proximal sites (TSS-proximal ISs) and intragenic sites (intragenic ISs) are shown by the left, middle or right group of bars, respectively. The number of genes (n) belonging to each category is indicated under the correspondent bar.

