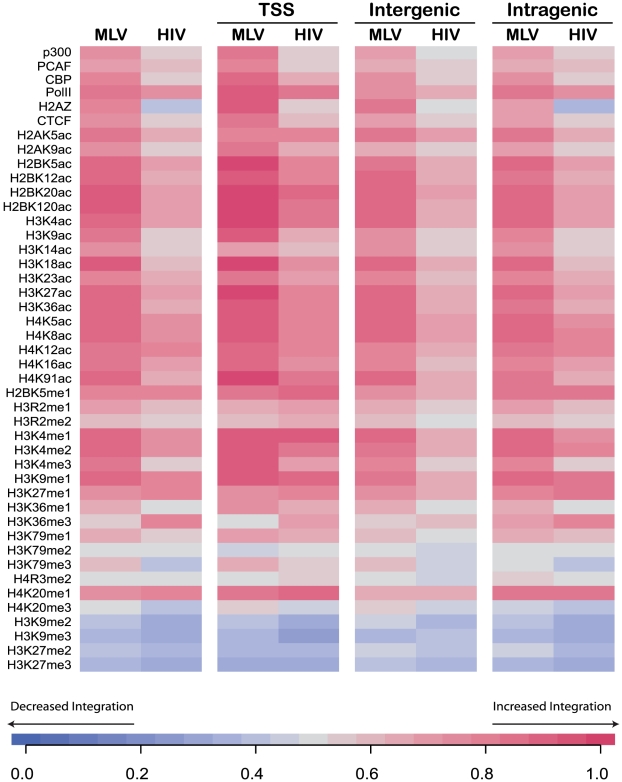
Figure 2. Association between histone modifications and retroviral integrations in T cells.
Each row in the heat map corresponds to a different DNA-bound protein (p300, PCAF, CBP, Pol II, H2A.Z, CTCF) or histone post-translational modification (acetylation, ac, and methylation, me), according to the ChIP-seq databases from Barski et al. [20] and Wang et al. [21]. Chromatin features were annotated in an interval of ±500 bp around MLV and HIV vector integrations, as whole datasets or split into the three classes reported in Figure 1a. Color shades from blue to red are indicative of the direction and the strength of the association between epigenetic features and integrations, as calculated by statistical comparison against matched random controls using the ROC area method [23]. ROC values between 0 and 0.5 (blue shades) reflect a negative correlation compared to random, 0.5 (grey) means no correlation, values above 0.5 (red shades) indicate a positive correlation. Results of statistical tests comparing data sets to each other and to random can be found in the Supplementary statistical analysis S1.

