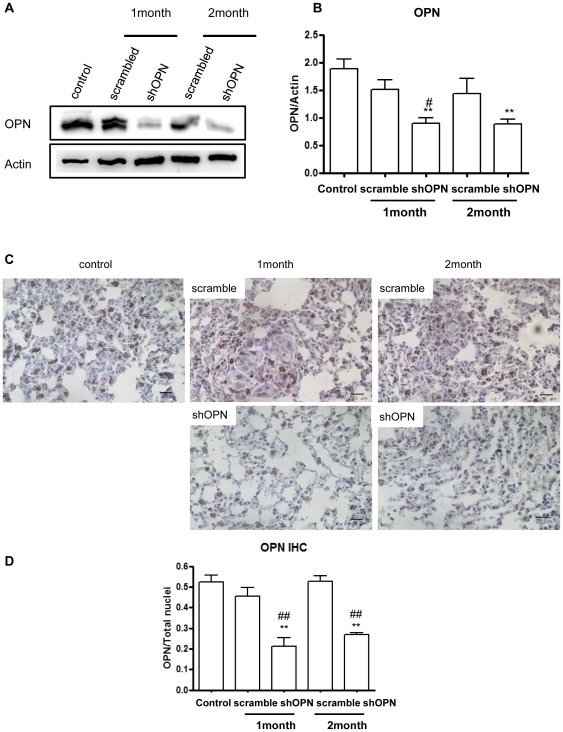
Figure 2. Effect of Aerosol-delivered shOPN on expression level of OPN.
(A) Western blot analysis of OPN. (B) Densitometric analysis of OPN. (C) Immunohistochemical analysis of OPN. Magnification: ×400. Scale bar: 20 µm. (D) Comparison of OPN labeling index. Each bar represents the mean± S.E.M (n = 3). *Statistically significant different (P<0.05) compared to control group. **Statistically different (P<0.01) compared to control group. #Statistically different (P<0.05) compared to scrambled control. ##Statistically different (P<0.01) compared to scrambled control.

