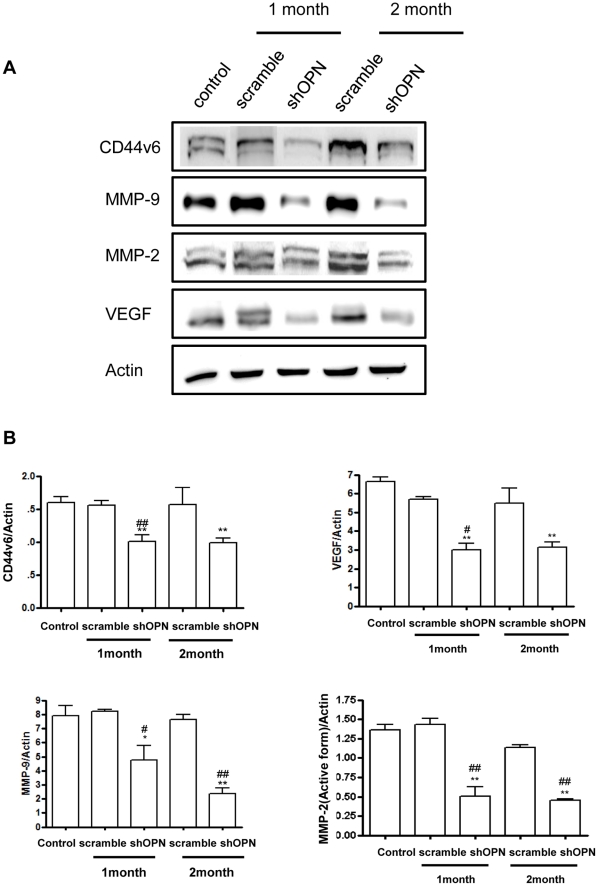
Figure 3. Western Blot Analysis of CD44v6, VEGF, MMP-9, and MMP-2.
(A) Expression of CD44v6, VEGF, MMP-2, and MMP-9 in the lung. (B) Bands-of-interest were further analyzed by densitometry. Each bar represents the mean± S.E.M (n = 3). *Statistically different (P<0.05) compared to control group. **Statistically different (P<0.01) compared to control group. #Statistically different (P<0.05) compared to scrambled control. ##Statistically different (P<0.01) compared to scrambled control.

