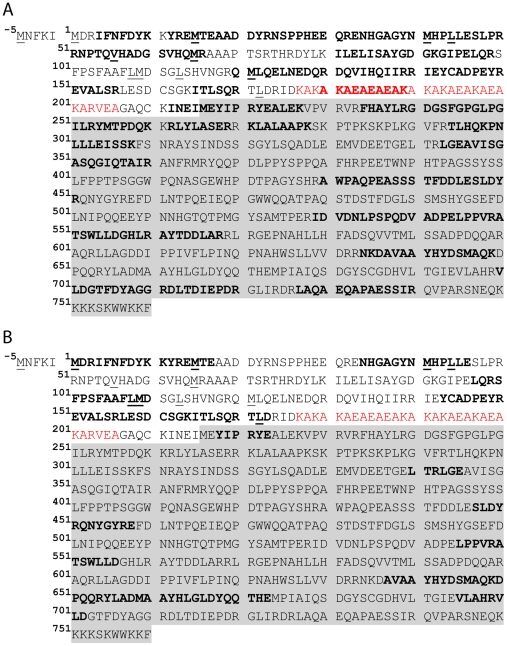
Figure 3. Analysis of the XopD protein sequence by mass spectrometry.
XopD216-760 protein sequence is shadowed. All possible translation starts situated in frame and upstream the annotated M216 are underlined. Peptides identified by Nano LC/ESI MS/MS analysis following trypsin (A) or V8 protease (B) digestion of the purified XopD protein are shown in bold. The 30 amino acid low complexity KAE-rich region is indicated in red.

