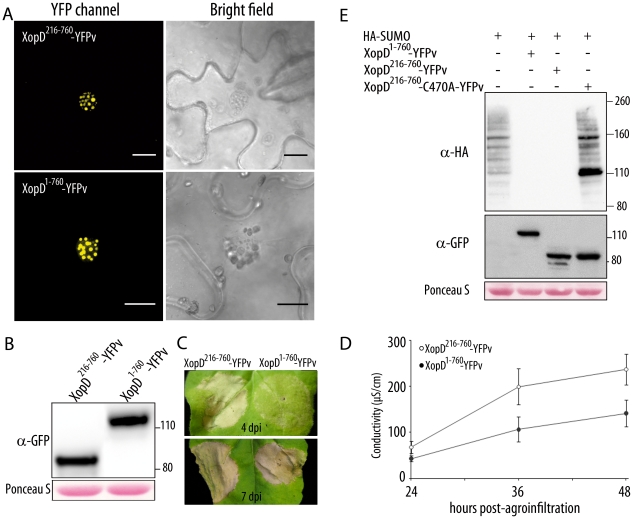
Figure 5. Characterization of XopD1-760 expression and function in N. benthamiana.
(A) Confocal images of epidermal cells of N. benthamiana leaves expressing YFPv-tagged XopD216-760 and XopD1-760 36 hours after agroinfiltration. Bright field images are shown on the right. Bars = 15 µm. (B) Western blot analysis using an anti-GFP antibody shows expression of YFPv-tagged XopD216-760 and XopD1-760 constructs, 36 hours after agroinfiltration. Ponceau S staining of the membrane illustrates equal loading. (C) Cell death development 4 (upper panel) and 7 (lower panel) days after agroinfiltration of YFPv-tagged XopD216-760 (left) and XopD1-760 (right) constructs. (D) Cell death was quantified by measuring electrolyte leakage in N. benthamiana leaves expressing YFPv-tagged XopD216-760 (open circles) and XopD1-760 (filled circles) at the indicated time points after agroinfiltration. Mean and SEM values are calculated from 3 independent experiments (8 replicates/experiment). The statistical significance in mean conductivity values obtained with leaves expressing XopD216-760 or XopD1-760 was assessed by using a Student's t test (P value <10−5). (E) SUMO-conjugates detected by Western blot analysis using an anti-HA antibody 36 hours after agroinfiltration of the indicated constructs. Expression of XopD proteins was revealed using an anti-GFP antibody. Ponceau S staining of the membrane illustrates equal loading.

