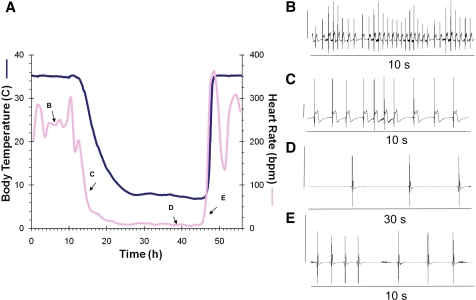
Fig. 1.
A: simultaneous tracing of heart rate (pink line; 1-h moving average) and core body temperature (blue line) collected with an implanted transmitter in a thirteen-lined ground squirrel during the initial seasonal torpor bout (November) at an ambient temperature of 5°C. ECG readings from the indicated points on the heart rate tracing show 10-s interval where the heart rate was ∼240 beats/min (inset B); entry into torpor over 10 s at a heart rate of ∼80 beats/min (inset C); 30 s during torpor to show multiple beats at a heart rate of 8 beats/min (inset D); arousal ECG where the heart rate is 15 beats/min (inset E). In B–E the vertical line on the left side of the ECG equals 1 mV to indicate the changes in height of the R peak.

