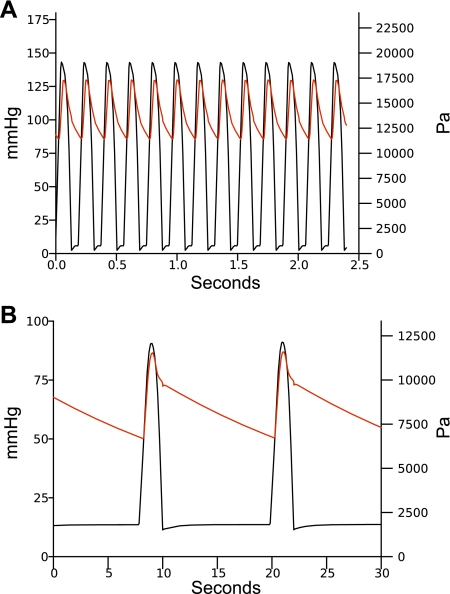
Fig. 5.
Model blood pressures. In both plots, the black line is the left ventricular pressure and the red line is the pressure in the large systemic arteries compartment (a1). A: pressures for a heart rate of 320 beats/min with a fixed blood temperature of 35.0°C. B: pressures for a heart rate of 5 beats/min with a fixed blood temperature of 7.7°C.

