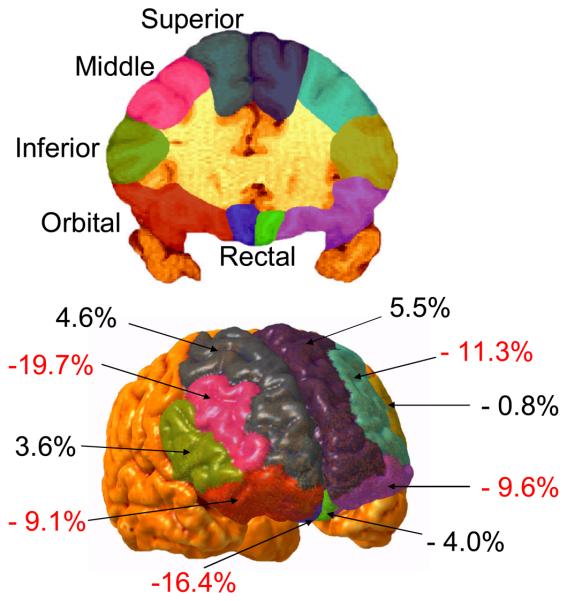
Figure 2.
Coronal view (upper figure) of the frontal cortex illustrating segmentation into superior, middle, inferior, orbital, and rectal sub-regions, and a three-dimensional view (lower figure) illustrating the percentage volume reduction (or increase) in those with Antisocial Personality Disorder compared to normal controls. Significant volume reductions in APDs are coded in red.

