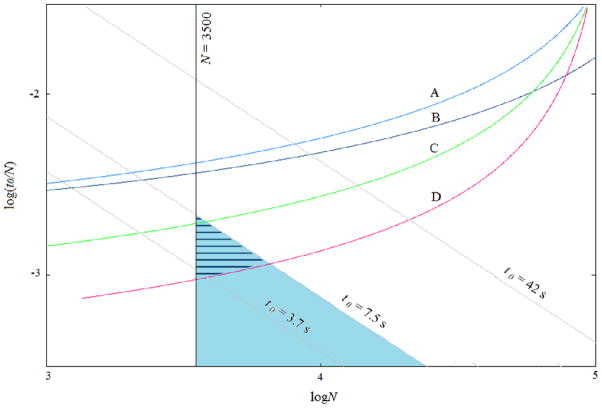
Figure 1. Poppe plots for various liquid chromatography configurations.
A: 2.6 μm particles, 4000 psi, 25 °C. Chromatograms from Jung, et al.9 and related unpublished work with 2.6 μm particles were used to establish an estimate of the “C term” which is the most important term for high-speed work. The dimensionless C term, which includes a contribution from the postcolumn reactor, was determined to be 0.22. Typical values of 2 and 1.5 for B and A respectively were used. These values represent data for 1.7 μm particles well. In order to determine Poppe plots with new conditions we used published equations and temperature dependence of viscosity20 B: 2.6 μm particles, 7000 psi, 25 °C, C: 1.7 μm particles, 7000 psi, 25 °C, D: 1.7 μm particles, 7000 psi, 70 °C. Here, N is the number of theoretical plates, t0 is the dead time for unretained analytes, and t0/N is plate time. Separation conditions that overlap with the desired separation time for serotonin<1 min, corresponding to t0<7.5 s, and that are accessible are denoted by the hatched blue area.

