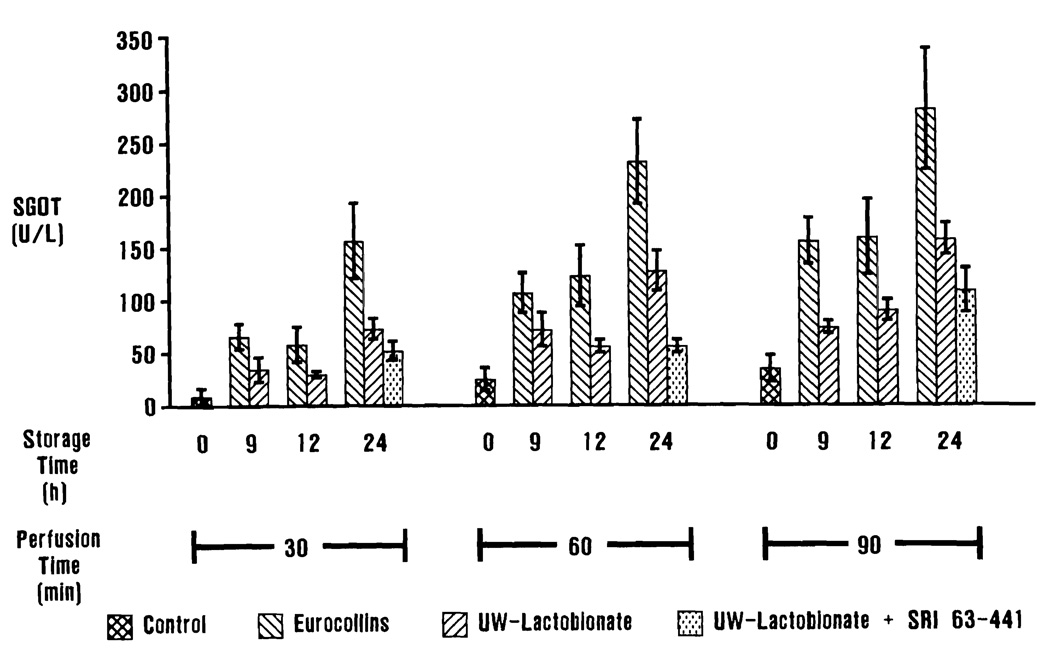
Figure 2.
Perfusate SGOT levels. Differences in SGOT liberation into the perfusate are most dramatically demonstrated after 24 h of preservation. Serum glutamic oxaloacetic transaminase release from livers stored for 24 h in UW solution is comparable to the values at 9 and 12 h for livers stored in EC solution. Perfusate levels of SGPT, LDH, and glucose, and bile production followed a similar pattern.

