
Fig. 1.
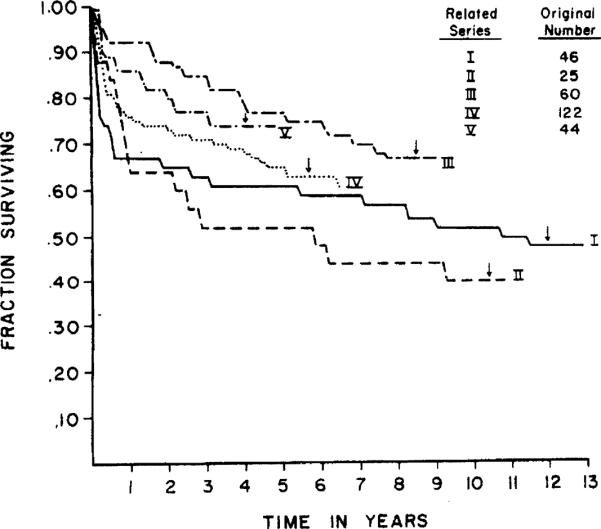
Life survival curves of patientr treated with primary related homografts during five intervals from 1962 to the summer of 1972. Arrows show time of minimum follow-up. Description of sofibs is in Table 1.
Official websites use .gov
A
.gov website belongs to an official
government organization in the United States.
Secure .gov websites use HTTPS
A lock (
) or https:// means you've safely
connected to the .gov website. Share sensitive
information only on official, secure websites.
Life survival curves of patientr treated with primary related homografts during five intervals from 1962 to the summer of 1972. Arrows show time of minimum follow-up. Description of sofibs is in Table 1.