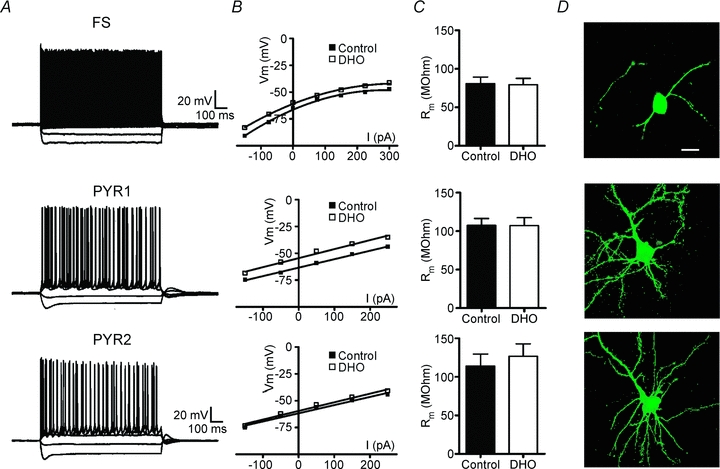
Figure 3. DHO does not alter input resistance in any of the different neuronal types.

A, current clamp recordings in response to applied intracellular current steps (−150 to 300 pA, 1 s) in a FS, PYR1 or PYR2 neuron. Note the similarity in the recordings from both types of PYR neurons. B, V–I plots of cells recorded in A in control or during the peak membrane depolarization in response to DHO application (100 μm, 30 s). C, mean (±s.e.m.) membrane resistance (Rm) calculated from current steps applied in control or during DHO. Na+ −K+ ATPase blockade by DHO did not significantly alter Rm in any of the cell types. Additionally, no difference was observed between the PYR1 and PYR2 groups (P = 0.73 control, P = 0.33 with DHO). D, representative biocytin-filled neurons of each recorded cell type. Scale bar: 20 μm applies for all images.
