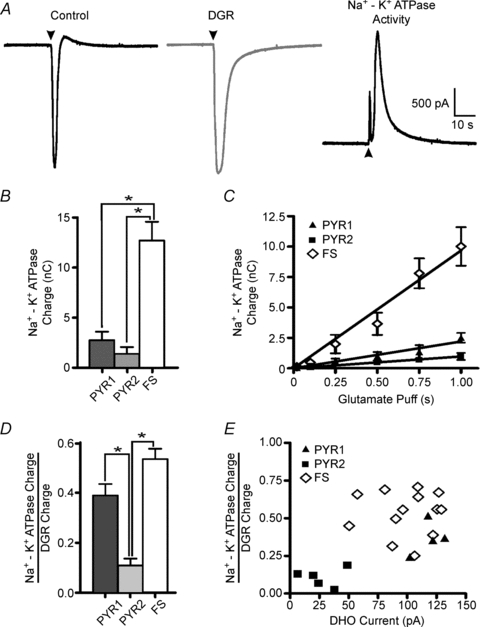
Figure 4. Glutamate puff-induced activation of the Na+ −K+ ATPase.

Glutamate (20 mm) was locally delivered through a patch-pipette by a brief pressure pulse (31 kPa, 1 s). A: left, representative trace from a FS interneuron under voltage clamp in response to a glutamate puff in control. Glutamate evoked a large amplitude, fast rising inward current followed by a rebound outward current. Middle, following blockade of the Na+ −K+ ATPase with 100 μm DHO the glutamate puff is repeated and the DGR recorded. Right, digital subtraction of the DGR response from the control response reveals the underlying DHO-sensitive Na+ −K+ ATPase current (Na+ −K+ ATPase activity). B, Na+ −K+ ATPase charge (mean ± s.e.m.) for FS, PYR1 and PYR2 neurons calculated as the area under the Na+ −K+ ATPase activity curve and then averaged across trials (see Methods for more details). PYR neurons were grouped based on the amplitude of the current induced by DHO as in Fig. 1. C, comparison of Na+ −K+ ATPase charge for the three groups across multiple glutamate puff durations. D, an estimate of the fraction of Na+ −K+ ATPase activity induced by the glutamate puff (Na+ −K+ ATPase charge) against the total induced non-Na+ −K+ ATPase activity (DGR charge) (mean ± s.e.m.). E, fractional glutamate puff-induced Na+ −K+ ATPase activity is plotted against the resting Na+ −K+ ATPase activity (DHO current). *P > 0.05, Vm = −70 mV.
