
Figure 2. Experimental set-up and measurement of short-latency direction.
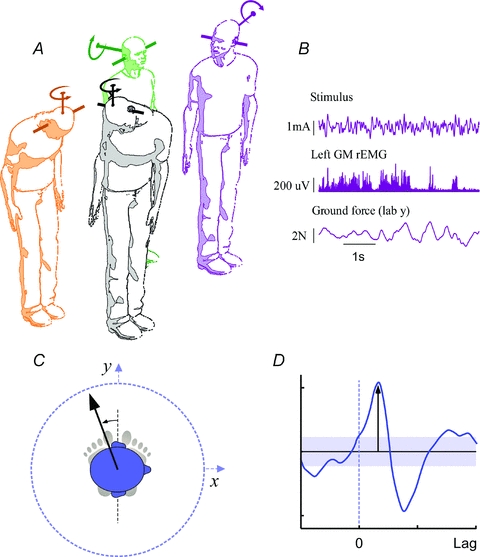
A, postures adopted in this study. Clockwise from left: head forward-down, head forward-upright, head right-upright, head right-down. The orientation of predicted linear (Fig. 1A) and rotational head motion (Fitzpatrick & Day, 2004) vectors evoked by binaural–bipolar GVS are shown. Pitching the head down changes the orientation of the rotation vector from one that signals roll to one that signals yaw, but the functional relevance of the inter-aural linear vector is unchanged (Cathers et al. 2005). B, example of raw data from head right upright binaural experiment (stimulus waveform, left gastrocnemius rectified EMG, and anteroposterior force). C, measurement of short-latency direction. The linear arrow shows the positive direction of the axis along which the largest positive value for the first peak in the SVS–force cross covariance (D) was found (method detailed in Mian & Day, 2009). The direction is represented with respect to the inter-aural line. The shaded segment in D represents the 95% confidence interval for significance of correlation.