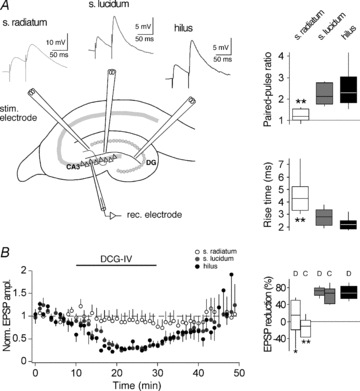
Figure 1. Isolation of mossy fibre inputs to CA3 pyramidal neurons.

A, left, schematic drawing of a hippocampal section where electrodes were placed to stimulate distinct afferents of a CA3 pyramidal cell. Top, examples of EPSPs evoked in a paired-pulse protocol (50 ms interstimulus interval) by stimulation in the s. radiatum (activating presumably non-MFs, light grey trace), in the s. lucidum (activating presumably MFs, dark grey trace) and in the hilus (activating presumably MFs, black trace). Notably, rise times of s. radiatum EPSPs were slower. Right, box-and-whisker plots of EPSP parameters measured with s. radiatum, s. lucidum and hilus stimulation. In each box, the mid-line shows the median, the top and the bottom show the upper and lower percentiles (75th and 25th) and the whiskers show 90th and 10th percentiles. B, left, plot showing the effect of 4 μm DCG-IV on EPSPs evoked by stimulation in s. radiatum (white circles), s. lucidum (grey circles) and hilus (black circles). Each data point represents the average of 6 EPSPs during 1 min. Right, box-and-whisker plot showing EPSP reduction upon application of either 4 μm DCG-IV (D) or 20 μm l-CCG-I (C). Asterisks indicate that parameters recorded with radiatum stimulation were significantly different from those recorded with either lucidum stimulation or hilus stimulation (unpaired t test; *P < 0.05; **P < 0.01). The lack of significant EPSP amplitude changes when evoked by s. radiatum stimulation indicates that both group II mGluR agonists at the concentrations used were unlikely to have had unspecific effects.
