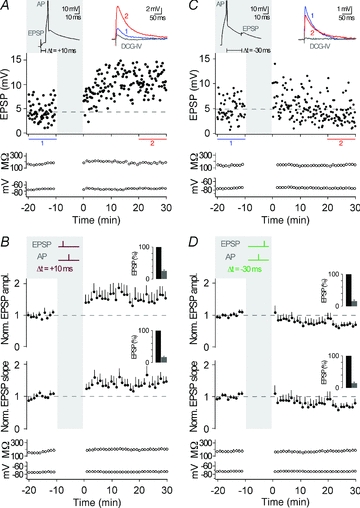
Figure 3. Pairing of synaptic activation with a single action potential.

A, representative recording from a CA3 neuron showing t-LTP when single APs were evoked 10 ms after an EPSP, repeated 60 times at 0.1 Hz (see grey inset, Δt = +10 ms; AP is clipped). EPSP amplitude, input resistance and membrane potential are plotted against time. The coloured EPSP traces (top right inset) are averages of all EPSPs recorded during the time periods indicated by the correspondingly coloured bars or recorded in the presence of group II mGluR agonists (in grey). B, average of all recordings, where a STDP protocol consisting of an EPSP followed by a single AP was applied (as shown by the schematic drawing in the grey inset; Δt = +10 ms). t-LTP was induced (n = 7, P < 0.05). The bar insets illustrate the reduction of EPSP amplitudes or EPSP slopes by the group II mGluR agonist; EPSPs were set to 100% before washing in the group II mGluR agonist. C, representative recording from a CA3 neuron showing t-LTD when a single AP was followed by an EPSP with a time delay of 30 ms (Δt = −30 ms). D, average of all recordings, where a STDP protocol consisting of a single AP before an EPSP (Δt = −30 ms) was applied. t-LTD was induced (n = 7, P < 0.05).
