
Figure 2. Mean (± s.d.) maximum change for CO, SV, MAP, HR and blood flow in the passive and control leg.
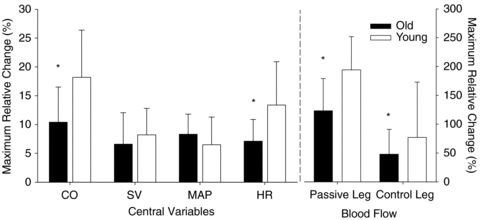
*Significant attenuation in the old group compared to the young group (P < 0.05). Vertical dashed line separates variables associated with the right and left axes.