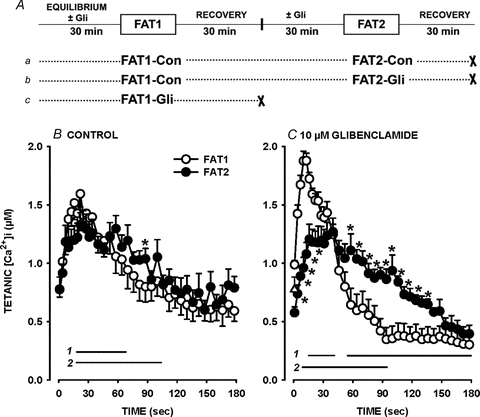
Figure 1. The decreases in tetanic [Ca2+]i were slower during a second fatigue bout (FAT2, •) than during a first bout (FAT1, ○) in the presence of glibenclamide.

A, fatigue protocols. All fatigue bouts were elicited with one tetanic contraction every second for 3 min. ‘×’ indicates the end of an experiment. B and C, FAT1 and FAT2 were elicited under control conditions (Con) (B) or in the presence of 10 μm glibenclamide (Gli) (C). Tetanic [Ca2+]i is the maximum [Ca2+]i observed during the tetanic contraction. ▵, tetanic [Ca2+]i prior to FAT1-Con that preceded FAT2-Gli. Vertical bars represent the s.e.m. of 11 fibres for all conditions except for FAT1-Gli with 19 fibres. Horizontal bars (with numbers indicating the fatigue bout number) represent the time period when mean tetanic [Ca2+]i was significantly different from the value at time 0 s; *mean values for FAT1 and FAT2 were significantly different. ANOVA and LSD, P < 0.05.
